Dashboard
The Dashboard is the landing page after login. It provides an at-a-glance view of your privileged access risk posture.
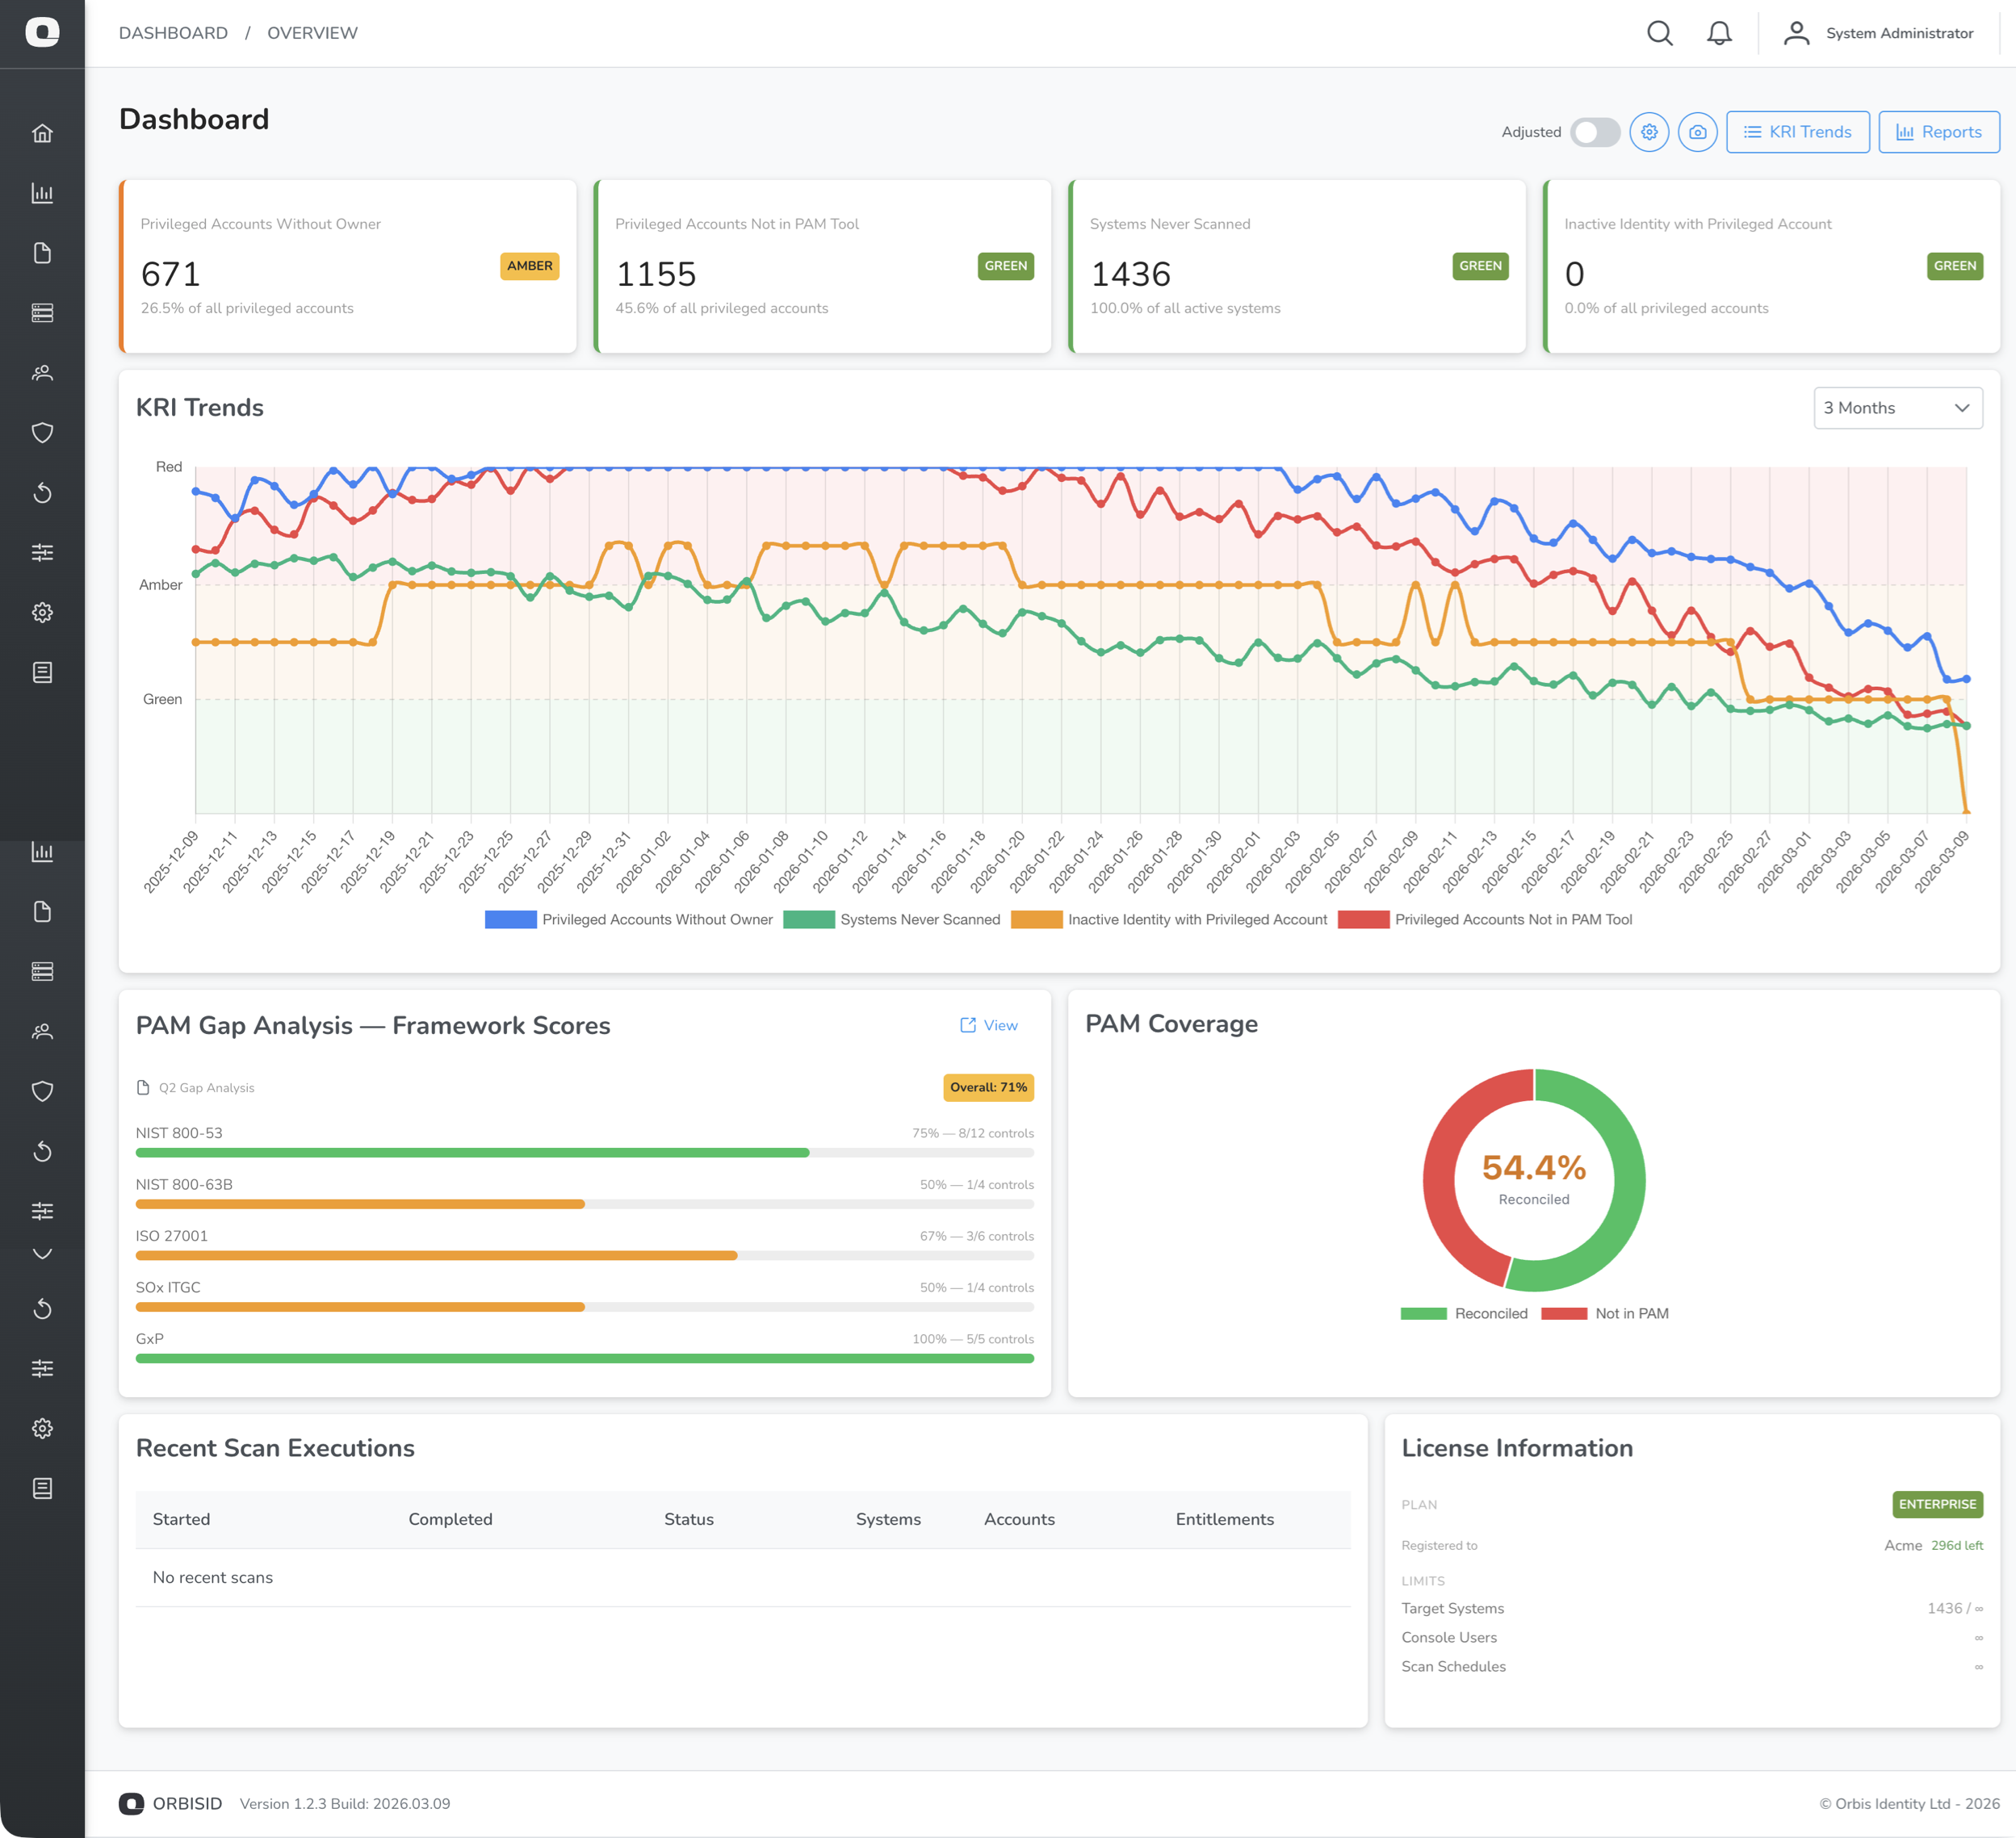
KRI Summary Cards
The top of the dashboard shows a card for each active Key Risk Indicator (KRI). Each card displays:
| Element | Description |
|---|---|
| KRI name | The indicator being measured |
| Current value | The latest calculated count or percentage |
| RAG status | Green, Amber, or Red based on configured thresholds |
| Trend arrow | Up, down, or flat compared to the previous value |
The Community edition shows 4 KRIs (Privileged Without Owner, Unlinked Accounts, Not in PAM Tool, Standing Privileges). Pro and Enterprise editions show all KRIs.
KRI Trend Chart
Below the summary cards, a line chart shows KRI values over time. The chart background is colour-coded using RAG bands so you can see at a glance whether values are trending into warning or critical zones.
System Summary
The system summary panel shows:
| Metric | Description |
|---|---|
| Total Systems | Number of target systems in inventory |
| Active Systems | Systems currently in scope for scanning |
| Offboarded Systems | Systems removed from scope (history preserved) |
| Total Accounts | All discovered accounts across all systems |
| Linked Accounts | Accounts matched to an identity |
| Unlinked Accounts | Accounts without an identity owner |
| Total Identities | Number of identities in the system |
Recent Scans
A table at the bottom shows the most recent scan executions with:
- Scan policy name
- Start and end times
- Status (Completed, Failed, Running, Cancelled)
- Number of systems scanned
Click a scan to view its detailed logs.
Data Refresh
Dashboard data is refreshed automatically when the page loads. To refresh manually, navigate away and back, or reload the page.